Categories
Communications Computers English Networking Routers

OpenWrt: Monitor your IPv6 Status

I recently had a full outage of IPv6 on my Deutsche Glasfaser fibre-based internet line that lasted for more than 3.5 months. I only found out by chance, which I found very frustrating. If it happens again I want to be notified immediately, so I built an automation that has the following architecture:

  • OpenWrt-based router/internet gateway sends event every time WAN interface changes with respect to IPv6
  • Event lands in an MQTT broker
  • Home Assistant: set up sensor based on messages sent to MQTT topic
  • Home Assistant: set up automation if IPv6 status sensor changes to “broken”

Here’s the details:

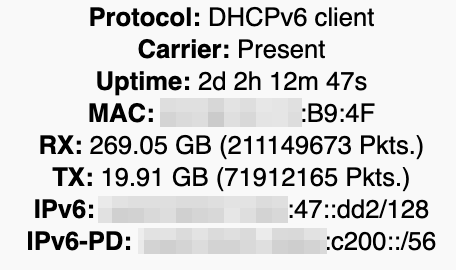
First we need events to be generated if and when the status of our WAN interface (more specifically the IPv6-specific interface named wan6) changes. We can easily and elegantly accomplish this by using the “Hotplug” mechanism built into Linux and OpenWrt. I had to write a script that parses the IPv6 status on changes of the wan6 interface and determines the IPv6 assignment and delegation of a prefix. If these are not available, then the status is “unhealthy.”

Here’s my script which I deployed as /etc/hotplug.d/iface/99-ipv6-monitor:
Categories
Communications Computers deutsch Linux Networking

VLANs in Proxmox

Ich habe seit einigen Jahren in meinem Heimnetz VLANs in Benutzung. Das funktioniert super, aber bisher habe ich mich noch nicht getraut, “Proxmox” auch zur Benutzung von VLANs zu befähigen. Ich habe da mittlerweile mehr als ein Dutzend verschiedene Dienste “produktiv” laufen, und ich wollte einfach nix kaputt machen. 😉

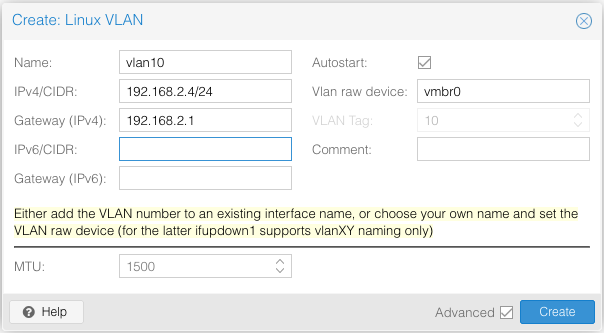
Jetzt am Wochenende war es aber so weit, ich habe mich da ran getraut. Und was soll ich sagen? Meine Sorge, etwas kaputt zu machen, war völlig unbegründet. Das Ganze ist super leicht konfiguriert, und wenn man es gut plant und ein bisschen vorsichtig ist, knirscht es auch nicht im Getriebe… 😉

Da mein (bisher einziger) Proxmox-Node im Headless-Betrieb läuft, besteht die Gefahr mich selbst durch Änderungen an der Netzwerkkonfiguration auszusperren. In einem solchen Fall müsste ich den Mini-PC, auf dem Proxmox läuft, mit einem Monitor und einer Tastatur ausstatten, um diesen wieder bedienen zu können, was — vermeidbaren — Aufwand bedeuten würde.

Ich habe mir daher einen kleinen “Trick” einfallen lassen. Einfach einen USB-Ethernet-Adapter in den Mini-PC eingesteckt, und ich hatte einen zusätzlichen Netzwerkport, über den ich dann als Fallback auf meinen Proxmox-Node zugreifen können würde.

Categories
Computers English Networking Routers

WireGuard on OpenWrt: no IPv6 routing?

I recently configured my router to be a WireGuard gateway, so that I can dial into my home to reach my NAS. After I had set it up and all seemed to be working well, I noticed that IPv6 packets didn’t get out to the internet, when I did a ping on my laptop:

$ ping6 ipv6.example.net
PING6(56=40+8+8 bytes) fd00:9::4 --> 2a01:123:456:7890::2
^C
--- ipv6.example.net ping6 statistics ---
624 packets transmitted, 0 packets received, 100.0% packet loss

I immediately suspected a routing issue, and so I did the below test on my router:

root@gw:~# ping6 -I fd00:9::1 ipv6.example.net
PING ipv6.example.net (2a01:123:456:7890::2) from fd00:9::1: 56 data bytes
ping6: sendto: Network unreachable

This seemed to have confirmed my suspicion. But why is there a routing issue?

I remembered that the WireGuard clients are all using reserved IP addresses — both IPv4 and IPv6. For IPv4 my router is doing masquerading, but it doesn’t do so for IPv6. It passes these addresses (from public address space!) out to the internet, which is the default setup for OpenWrt.

Now, in the case of the VPN network, where reserved addresses from the range of fd00:9::1/64 are used, packets with source addresses from the reserved IP address range can’t be routed on the internet, which is why I was seeing the “Network unreachable” error message.

Categories
Computers Debian English Linux Networking Routers Ubuntu

rsyslog Configuration for remote Logging

I want all the network devices in my house to log to a central location, so that log messages can be

  • stored permanently (if I switch off an access point, normally all logs are gone), and
  • automatically checked for interesting events.

So I needed to set up my internal Ubuntu-based server to receive log messages from these devices via the syslog protocol.

My requirements were:

  • Logs from different devices should go into a dedicated file each.
  • Logs from the local machine should not go into any of these files, but the standard Ubuntu logging should be continued to be observed.

It took me a while to figure out how the “ultimate” configuration should be, but here’s the result in case anybody else has similar requirements:

Categories
Communications English Networking Security Travel

Doing “IT” from Egypt

I was recently in Egypt for two weeks of vacation. As I’m running my own “bare-metal” root server, I needed to take care of it even while on vacation, to look after updates and alerts on a daily basis.

So I prepared myself well, and I would like to briefly let you know what I did, and what worked, and what didn’t work.

Preparation

First, I set up WireGuard on my server. It’s a UDP-based VPN that is very lightweight and fast. By chance I found out, though, that Egypt doesn’t work in Egypt, as it’s being blocked by Egypt’s authorities. 🙁

So I looked for alternatives and came across Outline. Outline is not actually a “real” VPN, but a proxy using the Shadowsocks protocol, which was explicitly designed to circumvent internet censorship. It can also proxy UDP traffic.

That is one amazing piece of software.

For certain Cloud Service Providers (Digital Ocean (just $4/mo.!), Google Cloud, Amazon Web Services), you can literally install it with a single click in a desktop app, the Outline Manager, which is available for Windows, macOS, and Linux.

Categories
Communications Networking Routers

Wie man (physische) Netzwerkprobleme spielend leicht lokalisieren kann

Kürzlich habe ich endlich etwas “angepackt”, was ich schon seit einigen Jahren tun wollte: Ich habe das LAN in meinem Haus “logisch segmentiert” durch die Verwendung von VLANs, um unterschiedlichen Traffic auf jeweils einem einzigen Kabel transportieren zu können.

Wozu braucht man sowas? Ganz einfach, z. B. um ein Gästenetzwerk vernünftig implementieren zu können, wenn man mehr als nur einen WiFi-Access Point in seinem Netz hat. Anbieter wie Ubiquity haben sowas bestimmt so implementiert, dass auch technisch weniger bewanderte Personen es nutzen können, aber mir ist Ubiquiti einfach zu teuer in dem Ausmaß, in dem ich deren Hardware bräuchte. Außerdem macht es ja auch schlicht Spaß, sich sowas auf Open Source-Basis selbst zu bauen… 😉

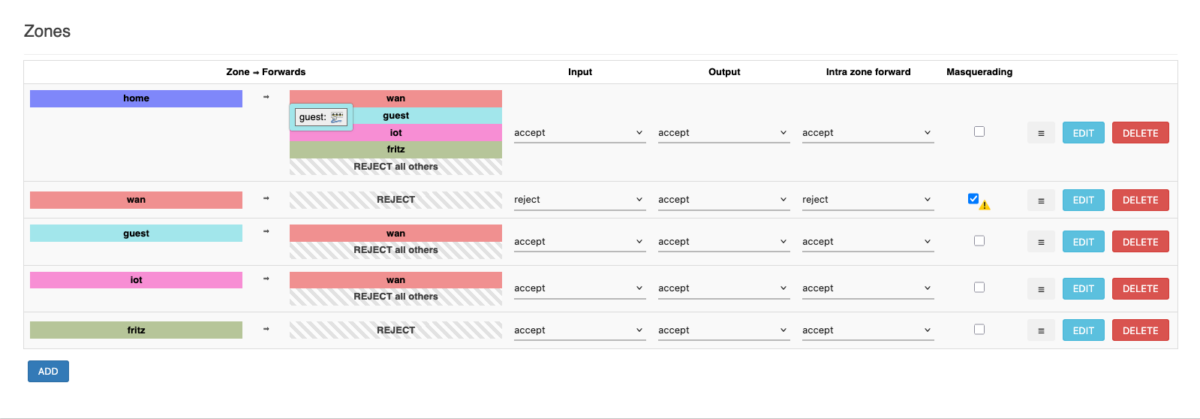
Ich habe bei mir also auf OpenWrt-Basis ein (für ein Einfamilienhaus) relativ komplexes Netzwerk aufgebaut. Folgende Komponenten sind u. a. enthalten:

Jetzt hatte ich kürzlich ein Problem, an dem ich wirklich hart zu “knacken” hatte. Irgendwann kam ich zu dem Schluss, dass es nicht auf Layer 2 (Ethernet) oder höher (IP) liegen müsse, sondern eher auf Layer 1 (physikalische Ebene, also Verkabelung).

Ich habe mir also für sage und schreibe 10,99 EUR einen deleyCON Netzwerk-Kabeltester bestellt. Selbst für eine einmalige Anwendung (aber dabei bleibt’s ja nicht…) war mir der Preis akzeptabel.

Und siehe da, ich hatte tatsächlich ein Verkabelungsproblem in meinem Netzwerk. An einer Netzwerkdose war das Kabel nicht vernünftig aufgelegt.

Diesen Fehler hätte ich ohne den Kabeltester nicht gefunden. Der Tester ist wirklich auch von Personen, die keine ausgebildete Netzwerktechniker sind, sehr einfach zu nutzen. Signalgenerator ans eine Ende des Strangs hängen, “Abschluss-Stecker” ans andere, und schon werden die einzelnen Adern durchgetestet, und man kann durch LEDs sehen, wo der Fehler ist.

Ich kann dieses Gerät nur absolut weiterempfehlen. Für etwas mehr als einen Zehner kann man da nichts falsch machen…

Lasst mich gerne wissen, ob Ihr meine Meinung teilt, falls Ihr Euch auch dieses Gerät zulegen solltet…

Categories
Computers deutsch Networking Routers Windows

Mein Internet funktioniert nicht, was tun?!

Diesen Hilfeschrei hat bestimmt jeder schon oft gehört. Aber nur die wenigsten wissen, wie man heraus finden kann, wo genau das Problem liegt.

Ich versuche in diesem Blogpost einmal, eine auch für Laien verständliche bzw. leicht anwendbare Anleitung zu liefern, wie man bei Internetstörungen zu Hause dem Problem auf die Spur kommen kann…

Zunächst einmal ein paar (wenige) Grundlagen. Ohne diese geht es einfach nicht.

Egal, was Sie im Internet tun, alles passiert auf Basis sogenannter “IP-Pakete“. Jeglicher Datenverkehr wird “zerhackt” und in Form von kleinen “Häppchen”, eben dieser IP-Pakete übertragen. Alle Geräte, die am Internet teilnehmen, haben eine bestimmte Rolle. Ihr Handy, Laptop oder PC ist in der Regel ein sogenannter “Client“, also ein “Kunde”, die Dienste, die Sie in Anspruch nehmen, werden durch sogenannte “Server” (“Bediener”) erbracht. Wie findet nun Ihr Client den passenden Server? Das funktioniert über ein System namens “DNS“. Es übersetzt für den Menschen lesbare Adressen, wie z. B. “amazon.de“, in IP-Adressen, die Ihr Endgerät für die tatsächliche Kommunikation mit dem gewünschten Dienst benutzt.

Wie werden aber die IP-Pakete zwischen Ihrem Endgerät (Handy, Laptop, Tablet, PC) und den Servern im Internet übertragen? Zunächst muss Ihr Endgerät mit Ihrem eigenen lokalen Netzwerk (auch “LAN” genannt) bei sich zu Hause verbunden sein. Dies kann über WLAN (auch “WiFi” genannt) oder Netzwerkkabel (auch “Ethernet”-Kabel genannt) passieren. Von dort geht es über Ihren Router zu Ihrem Internetprovider, und dann von dort ins Internet. Welche physikalische Verbindungstechnik (Teilnehmeranschlussleitung) Sie zur Anbindung an Ihren Provider verwenden ist grundsätzlich egal: DSL, TV-Kabel, Glasfaser oder sogar Mobilfunk (z. B. über einen Vodafone GigaCube).

Categories
Communications English Networking

Netgear GS108Ev3 – Huge packet loss when pinging management IP

I have a quite complex infrastructure in my house, and I monitor everything.  Among others, I have SmokePing probes towards multiple destinations in my LAN, and also to my internet provider’s infrastructure, and even external hosts.

When I added a graph for the management IP of my Netgear GS108Ev3 8 Port Gigabit Ethernet Smart Managed Plus Switch, which is my “core” switch, I noticed that there is a huge packet loss, in the range of 4% average, about 40% max.

The strange thing is that other destinations in my LAN which can be reached via this switch, have absolutely zero packet loss. That means that the cabling itself is definitely ok, and also that the packet switching functionality of the switch is ok.

So I opened a ticket towards NetGear, and the response I got was quite surprising (but still somehow makes sense):

This is a known issue, and it is by design. The put the highest priority on the packets flowing thru the switch, while the management traffic has a lower priority, so that ICMP packets to the switch’s management IP may get lost, and in extreme cases the web UI may not be reachable at all.

It’s not a big issue for me, because in the end I wanted to create graphs that exhibit whether I have any internal packet loss. Whether the switch’s management interface has packet loss or not is not really important to me. As long as all my internal devices that I actively use, like my NAS devices or streaming boxes, are properly connected with no packet loss, all is well. 🙂

Categories
Computers Debian English Linux Networking

ntp running in chroot stopped working after Debian Stretch upgrade

Today I upgraded my root server from Jessie to Stretch, and suddenly ntp stopped working.

I found errors like follows in the log, which were obviously due to failures in name resolution:

2018-05-31T07:44:48.900756+00:00 myhost ntpd[22855]: giving up resolving host 1.debian.pool.ntp.org: Servname not supported for ai_socktype (-8)

The solution to make this work was to bind-mount some files and directories essential for name resolution into the chroot jail.

First create some directories and some dummy files:

# mkdir /var/lib/ntp/etc /var/lib/ntp/lib /var/lib/ntp/proc
# mkdir /var/lib/ntp/usr /var/lib/ntp/usr/lib
# touch /var/lib/ntp/etc/resolv.conf /var/lib/ntp/etc/services

Then update your /etc/fstab as follows:

...
#ntpd chroot mounts
/etc/resolv.conf  /var/lib/ntp/etc/resolv.conf none bind 0 0
/etc/services	  /var/lib/ntp/etc/services none bind 0 0
/lib		  /var/lib/ntp/lib none bind 0 0
/usr/lib	  /var/lib/ntp/usr/lib none bind 0 0
/proc		  /var/lib/ntp/proc none bind 0 0

Finally mount all these binds:

# mount -a

Thanks to the ArchLinux guys where I found this.

To check whether your ntp is working again, you can use the following command which shows a list of peers known to your ntp server:

# ntpq -p
     remote           refid      st t when poll reach   delay   offset  jitter
==============================================================================
 0.debian.pool.n .POOL.          16 p    -   64    0    0.000    0.000   0.000
 1.debian.pool.n .POOL.          16 p    -   64    0    0.000    0.000   0.000
 2.debian.pool.n .POOL.          16 p    -   64    0    0.000    0.000   0.000
 3.debian.pool.n .POOL.          16 p    -   64    0    0.000    0.000   0.000
*ptbtime1.ptb.de .PTB.            1 u   46   64  377   11.483   -0.411   0.201
+ptbtime2.ptb.de .PTB.            1 u   52   64  377   11.502   -0.533   1.069
+ptbtime3.ptb.de .PTB.            1 u   47   64  377   11.451   -0.510   3.866
#batleth.sapient 131.188.3.221    2 u   44   64  377    0.188    1.097   0.176
#5.199.135.170 ( 130.149.17.21    2 u   45   64  377   11.271    0.581   0.396
-mail.morbitzer. 193.175.73.151   2 u   47   64  377    2.760    0.556   0.278
#hotel.zq1.de    161.62.157.173   3 u   46   64  377    0.094    1.384   0.261
-ntp2.m-online.n 212.18.1.106     2 u   47   64  377    7.167   -0.333   0.190
#2a03:b0c0:3:d0: 81.94.123.16     3 u   49   64  377    6.288   -2.071   1.760
#touka.thehomeof 130.149.17.21    2 u   48   64  377    0.206    0.932   0.222
+maggo.info      124.216.164.14   2 u   42   64  377    0.278   -0.137   0.436
+weyoun4.cord.de 124.216.164.14   2 u   44   64  377    2.849   -0.255   0.409
+opnsense.sauff. 222.217.153.8    2 u   43   64  377    0.270   -0.617   0.167
-web1.sys.ccs-ba 192.53.103.104   2 u   35   64  377    0.173   -1.251   0.220
#uruz.org        122.227.206.195  3 u   49   64  377    0.216    1.694   0.309
#clients5.arcani 162.23.41.55     2 u   38   64  377    6.120   -1.500   0.130
+stratum2-1.NTP. 129.70.130.71    2 u   47   64  377   14.043    1.625   0.394

The following command confirms that your current time is actually correct (within certain limits, of course):

# ntpstat
synchronised to NTP server (192.53.103.108) at stratum 2
   time correct to within 15 ms
   polling server every 64 s

If this was helpful, I would be happy to hear from you.

Categories
Communications Computers English Networking Security Uncategorized

Monitoring Microsoft SNDS Status

If you operate a mail server, you should be aware of its “reputation,” because a bad reputation can give you issues sending email to certain recipients.

Microsoft operate a set of services called “Smart Network Data Services (SNDS)” to protect their own email services. If they see spam or other “malicious” activity from your address space, they might put you on a blacklist, and based on that reject email from you. It is easy to register yourself so that you can query the status of your IP address space. Just visit the above site and get started.

I created a quick’n’dirty monitoring script for Nagios to monitor the status of my IP address space in SNDS. Whenever there is data for one of my IP addresses, this script will return a WARNING status, so that I can look into it.

The script looks like follows:

#!/bin/bash

URL='https://postmaster.live.com/snds/ipStatus.aspx?key=12345678-1234-1234-1234-0123456789ab'

content="$(curl -s $URL)"
size=${#content}

if [ $size -gt 0 ]; then
    echo "WARNING:SNDS status seems to be UNHEALTHY"
    exit 1
fi

echo "OK:SNDS status is OK"
exit 0

You also need command and service definitions in Nagios as follows:

define command{
        command_name    check_snds
        command_line    /usr/local/lib/nagios/plugins/check_snds
}

define service {
        host_name                       my_host
        service_description             SNDS
        check_command                   check_snds
        use                             generic-service-internal
        notification_interval           0 ; set > 0 if you want to be renotified
}

Now, Nagios will monitor the “reputation” of your address space for you.